The argument about data centres is being fought with figures that do not survive contact with the engineering.
The brief
Four of the debate’s load-bearing claims: the water, the three per cent, the favourite metric, and the clean-energy label, checked against the source studies and the engineering. Each blames the building for demand the building does not create.
Entelligencia·July 2026·Sociogencia
Data centres have become a villain of the energy debate, and the coverage writes itself: vast windowless sheds, humming around the clock, drinking water and burning power while the public is told to take shorter showers. It is a tidy story. In four of its load-bearing claims it is also wrong.
We put these claims to Mark Acton, a data centre engineer of three decades and a contributor to The Next Hotspot, and checked them against the reporting standards and the source studies. What follows is not a defence of the industry. It is a correction of the arithmetic the debate is using.
Mark ActonData centre engineer, three decadesOn the record
Four myths, one mistake.
Case file · CASE 03 Compiled to the 30 June 2026 cut-off Grade before publish
VerifiedAnnouncedContestedEstimated
The mistake
The debate is doing the arithmetic wrong.
Four myths, graded against the record.
MYTH 01 · WATER
Data centres are draining the water supply.
VerifiedContested
Open
MYTH 02 · THE 3%
Data centres use 3% of the world’s electricity.
EstimatedContested
Open
MYTH 03 · THE METRIC
A low PUE proves a site is efficient.
VerifiedAnnounced
Open
MYTH 04 · CLEAN ENERGY
It runs on 100% renewable energy.
VerifiedAnnounced
Open
Analyst margin
Every counter-claim here is graded and sourced. The aim is not to defend the industry, but to correct the numbers so the argument worth having, about which regions and which grids, can actually happen.
Entelligencia desk
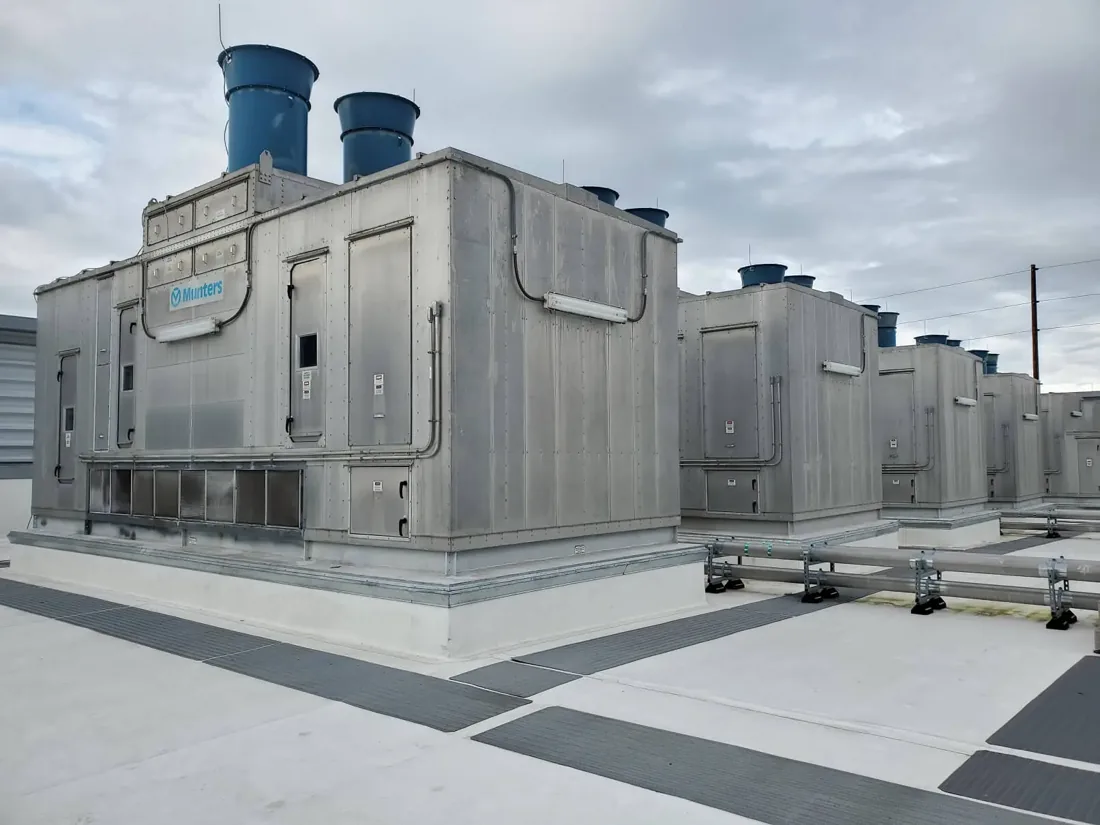
Exhibit AEvaporative towers, US
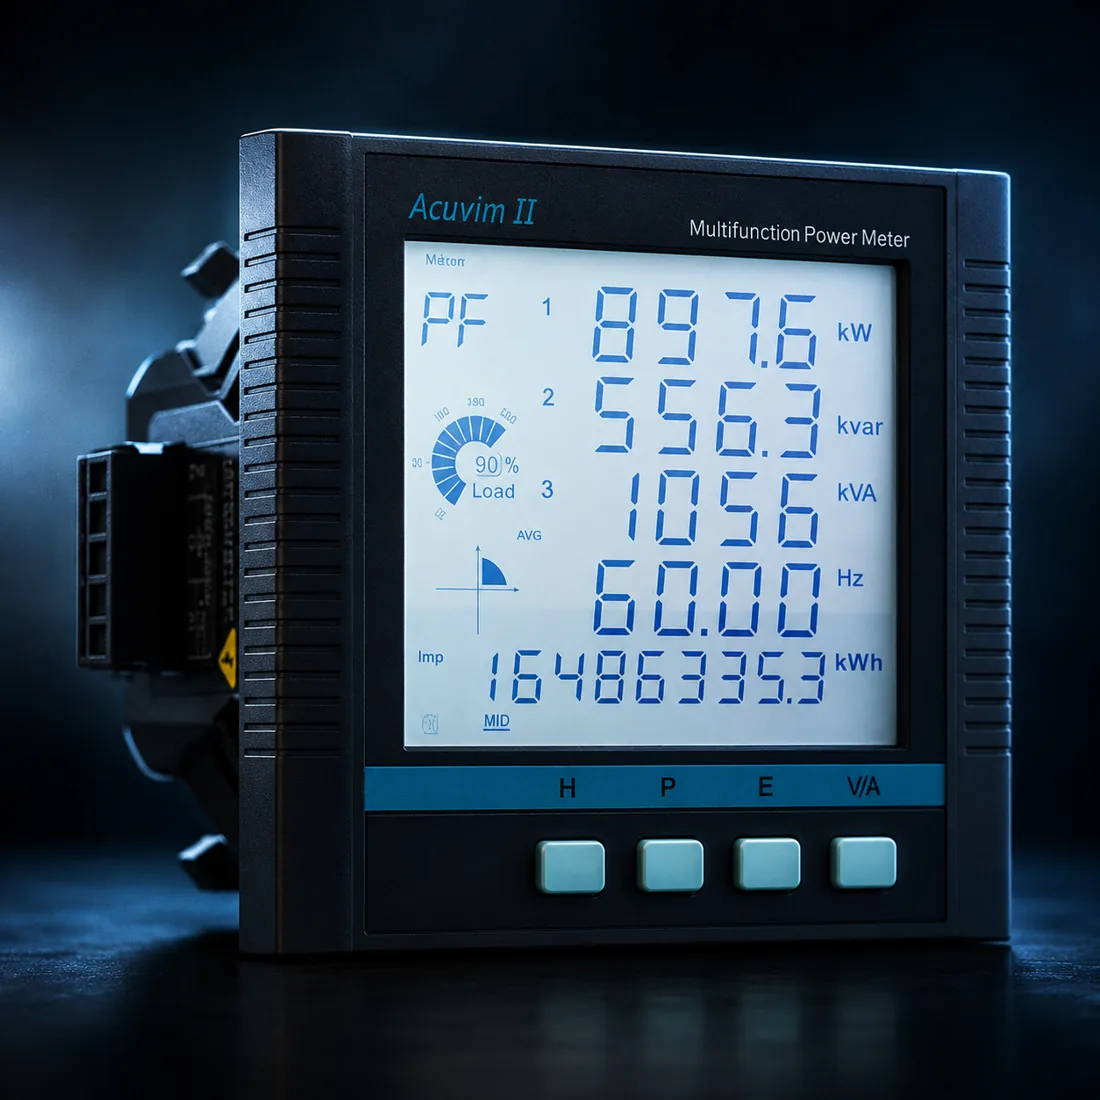
Exhibit BThe meter that gets quoted
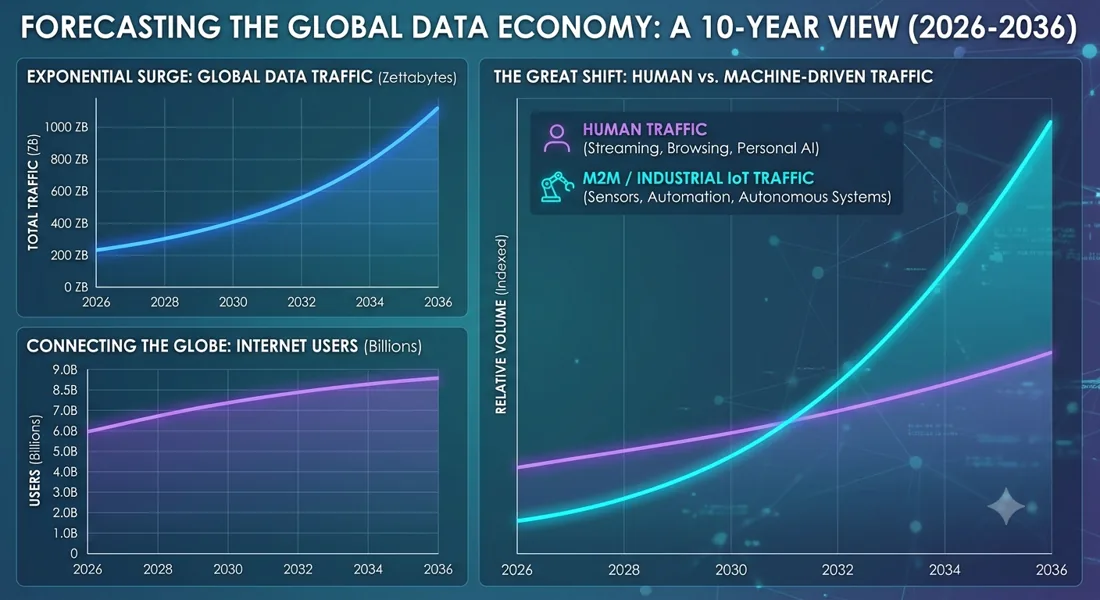
Exhibit CThe demand, not the building
The read
Correct the arithmetic first, then have the argument.
The water figures are mostly American, the three per cent belongs to the demand rather than the building, and the favourite metric measures overhead rather than total energy, and the clean-energy label is a yearly average rather than an hourly promise. One correction to our own correction: subsequent reporting has stressed that water is highly site-specific, that a national average of roughly 0.2 per cent tells you very little about any particular building, and that counting the power station behind the site can double or triple the footprint. Mostly overstated is not the same as unimportant, and this desk was cleaner about that than the evidence supports. None of that means there is nothing to worry about. It means the worries worth having are being buried under numbers that do not say what they are quoted to say.
techUK & the EA
The water record
The 73-site survey behind Myth 01.
The IEA
The electricity record
Energy and AI, 2025, behind Myth 02.
ISO/IEC 30134
The metrics
PUE, WUE, CUE, ERF and REF, behind Myth 03.
Mark Acton
The through-line
Three decades in data-centre engineering.
Data centres are quietly draining the water supply.
The figures are American
The headline fear is that data centres are quietly draining the water supply. The numbers behind it are real, but they are mostly United States numbers, where evaporative cooling towers are common and are sometimes run in genuinely water-scarce regions, occasionally drawing on aquifers that take centuries to refill.
And some of those American sites are a real problem, which is worth saying first. Google’s campus at Council Bluffs, Iowa, drew more than a billion gallons in 2024, and its plant at The Dalles in Oregon has at times taken more than a quarter of the town’s municipal supply. A 2025 investigation found the largest operators building in water-stressed parts of five continents. The point is not that no site strains its watershed. It is that these cases are being used to describe an industry that mostly does not look like them.
The problem has a geography, and it is mostly not here
Pick a cluster
Tap a bubble. The water story depends far more on where a data centre sits than on the fact that it is one; bubble size tracks local water stress.
Low stressModerateHighExtreme
Bubbles mark major data-centre clusters, sized and coloured by local water stress, not by build size. Positions are geographic; stress levels are Estimated, from public water-stress and siting data.
Most UK and European sites use closed-loop chilled-water or refrigerant systems. Once filled, the water recirculates rather than evaporates, the way coolant does in a car engine or a domestic heating system. Where water is used at all, it is typically for adiabatic top-up on a handful of the hottest days.
The source data bears this out. A techUK survey of 73 sites in England, run with the Environment Agency, found 64 per cent using under 10,000 m³ a year, less than a typical leisure centre; 51 per cent on waterless cooling; and 89 per cent either measuring their use or running cooling that needs no water at all. Only 4 per cent used more than 100,000 m³.
Most English sites use less than a leisure centre
Share of 73 surveyed English data centres by annual water use. techUK and the Environment Agency, 2025. Fifty-one per cent use waterless cooling. The caveat that keeps it honest: roughly 65 per cent of the sector’s total consumption sits in just six large facilities.
The honest caveats matter, because they are where the real argument lives. The sample was voluntary and anonymous, weighted to commercial colocation, and does not capture the largest new hyperscale builds. Use is highly concentrated: a WRc analysis of the same data put roughly 65 per cent of the sector’s consumption in just six large facilities, most of them recently online. The trend is upward, and the figure everyone omits is indirect: Bluefield Research estimates that by 2030 about 72 per cent of the water associated with a data centre will be consumed off-site, at the power stations generating its electricity, not in its cooling loop.
For scale, though, keep the national frame in view. Data centres are around 0.2 per cent of England’s non-household water use. A full year of their potable draw comes to roughly 1.88 billion litres; the water companies lose more than three billion litres every day to leaking pipes. The country’s data centres use less water in a year than the network leaks before lunch.
A golf course uses more.Mark Acton · data centre engineer
The line is sourced, not rhetorical: an English course typically irrigates with 50,000 to 150,000 m³ a year, against the 64 per cent of surveyed data centres sitting under 10,000.
Both are called a data centre
Scored 0 to 100 across five water and energy measures. Directional and editorial (Estimated), to show how much one label can hide.
VerifiedUK and European sites are mostly closed-loop; the techUK survey puts most English sites under a leisure centre’s annual use.
ContestedThe narrow-cooling figure understates the whole: consumption is concentrated in a handful of hyperscale sites, and most of the associated water is used off-site at power generation.
AnnouncedAmazon disclosed for the first time in June 2026 that its data centres used 2.5 billion gallons globally in 2025, a self-reported 52 per cent gain in water efficiency per kilowatt-hour since 2021.
Data centres use 3% of the world’s electricity.
A category error
The most-quoted statistic in the entire debate is that data centres consume around 3 per cent of the world’s electricity. As usually deployed, they do not. That 3 per cent is for digital infrastructure in total, which bundles in the communications networks and, in some versions, the transmission and the devices in our hands. Data centres on their own were about 1 per cent when the figure first went into circulation.
The correction still holds, but it needs a date on it. The IEA’s 2025 Energy and AI report puts data centres at roughly 1.5 per cent of world electricity in 2024, or 415 terawatt-hours, and projects that to roughly double to about 945 terawatt-hours by 2030, just under 3 per cent of the global total. The number has been growing at about 12 per cent a year since 2017. So the 3 per cent was misapplied when it was quoted, and data centres are no longer at 1 per cent, and within a few years the 3 per cent may finally be true, of data centres alone. That is the point, not a hole in it: the gap between what is claimed and what is real is closing fast, which is exactly why the argument has to be fought with the current figure rather than a convenient old one.
The number has moved, and it is still moving
Global data-centre electricity, terawatt-hours. Anchored to 415 TWh and about 1.5 per cent of world electricity in 2024, and roughly 945 TWh and just under 3 per cent by 2030. IEA, Energy and AI, 2025; intermediate years interpolated. The misquoted 3 per cent finally describes data centres alone around 2030.
There is a deeper category error underneath it. A data centre building does not, in any meaningful sense, consume power. It adds an overhead to the energy used by the IT equipment inside it, and that equipment runs because someone, somewhere, asked it to: a stream, a search, a model, a backup. The demand is ours. The building is just where it lands.
That framing is cleanest for inference, the everyday queries and streams the rest of us set off. It is more contested for frontier training. A single large training run can consume gigawatt-hours, initiated not by millions of us but by a small team chasing a commercial edge, so for that slice the demand is genuinely concentrated. Naming the exception is what keeps the rule honest.
Acton’s constructive proposal is to make the demand visible. We label food with its calorie content without banning the cake; we could label digital services with their energy cost and let people choose.
Try it · the energy label Acton proposes
Label the demand, not the building
0.3Wh
Every digital action carries an energy cost. The data centre is only where that cost is paid, not what creates it.
Illustrative orders of magnitude (Estimated), from published per-action estimates; heavy queries and long streams run higher. The training figure is per run, not per user, which is the whole point: that cost is concentrated in a few hands, not spread across all of ours.
Blaming the data centre for the demand is like blaming hotels for tourism.Mark Acton · data centre engineer
Which is not a blanket absolution, and Acton does not offer it as one. Some hotels are built in the wrong place. The analogy holds on where the responsibility sits, not on whether every build is wise.
EstimatedData centres were about 1.5 per cent of world electricity in 2024, on a path to roughly 3 per cent by 2030 on current trajectory (IEA, 2025).
ContestedThe demand-is-ours framing is strongest for inference; for frontier training runs, initiated by a few for competitive advantage, the demand is more concentrated.
A low PUE proves a site is efficient.
The favourite metric rewards the wrong thing
Power Usage Effectiveness, or PUE, is the number the industry reaches for to prove a site is efficient. It is a useful measure of one thing: how much overhead the building adds on top of the IT load. It is not a measure of whether the site is using less energy, and treating it as one is where the trouble starts.
PUE can be improved while total consumption rises. Pack in more IT load and the ratio falls even as the kilowatt-hours climb; strip out an inefficient legacy server and the ratio can get worse even as you save energy. Worse, the figure is widely quoted without the discipline that gives it meaning: under the ISO/IEC 30134-2 standard it must be measured over a full year, at the right boundary.
A number makes the trap concrete. Hyperscale operators routinely quote a PUE of 1.1 to 1.2, close to the theoretical floor. A 300 MW site running at 1.2 is a genuinely well-run building, and it still draws electricity on the order of a few hundred thousand homes. A better ratio on a bigger box is not less energy. It is a more efficient way of using more.
Overhead falls, total energy climbs
Best-in-class PUE has fallen towards the theoretical floor while total sector electricity has climbed. A lower ratio is a more efficient way of using more, not using less. PUE trajectory illustrates hyperscale best practice; total electricity anchored to IEA figures.
The same ISO 30134 series already defines metrics for water, carbon, energy re-use and renewable use, WUE, CUE, ERF and REF, that the sector has been slow to adopt. That is changing by law rather than by choice. The EU’s Data Centre Energy Efficiency Package, moving through adoption in 2026, builds an EU-wide rating scheme on precisely these indicators and opens the groundwork for minimum performance standards; Germany’s Energy Efficiency Act already requires new sites from July 2026 to hit a PUE no worse than 1.2. The wider metrics are becoming the reporting floor.
Even so, the lever that actually matters sits inside the racks: server utilisation, overprovisioning, ageing hardware, inefficient code. Chase those and the building overhead falls out of the argument.
VerifiedPUE measures building overhead, not total energy; the ratio can fall while absolute consumption climbs.
AnnouncedThe wider ISO 30134 metrics are shifting from voluntary to mandatory, as the EU rating scheme and national rules such as Germany’s EnEfG take them up through 2026.
It runs on 100% renewable energy.
Annual matching, not hourly truth
The reassuring line on almost every hyperscale announcement is that the site runs on 100 per cent renewable energy. It is the most defensible-sounding number in the whole debate, and it is doing more quiet work than any other.
Read the footnote and it usually means annual matching: across a year, the operator buys enough renewable power or certificates to equal what the site consumed. It does not mean the site drew clean power at every hour. When the wind drops at two in the morning, the racks keep running on whatever the grid is burning, and the certificates bought in a sunny month are still counted against it. The books balance over twelve months; the electrons do not.
The label is a yearly average, not an hourly promise
Annual renewable matching against hourly carbon-free energy. The hourly figure is Google’s reported average facility for 2023; it varies widely by grid, and falls further in fossil-heavy regions. The honest number is the hourly one.
The honest metric is 24/7 carbon-free energy, matched hour by hour on the local grid. This is the same mistake as the others, wearing a green coat: the annual figure charges the year, not the hour, and credits the building for power it did not use when it mattered. Google set a 2030 target for 100 per cent hourly matching; Microsoft has committed to the same, adding nuclear and hourly tracking; Amazon reached 100 per cent renewable in 2025 but still on annual matching, and is under scrutiny in fossil-heavy grids like Virginia and Ohio for exactly that gap. The direction is right. The label has run ahead of it.
The fix is the one the whole piece keeps arriving at: quote the number that describes reality. Hourly carbon-free matching, the CFE score and granular certificates already exist to measure it, and the GHG Protocol’s Scope 2 rules are under review to require the granularity. Until then, “100 per cent renewable” is an annual average doing the work of an hourly promise.
Verified“100 per cent renewable” is typically annual matching; on an hourly basis Google’s average facility was about 64 per cent carbon-free in 2023.
Announced24/7 carbon-free matching by 2030 is a target for Google and Microsoft, not a present reality; Amazon still relies on annual matching.
Test it · the site scorecard
Is the fear justified for this site?
The point of the whole piece is that the answer depends on the site, not the label. Build one and see where it lands.
The read
Pick the three above
Choose a location, a cooling type and a grid to score the site.
Water risk–
Carbon exposure–
A directional model (Estimated), not a site audit. Water risk blends cooling type and local water stress; carbon exposure tracks the grid, and rises where clean supply is only matched annually, not hour by hour.
Sources: IEA, Energy and AI (2025), for the electricity figures; techUK and the Environment Agency, Understanding data centre water use in England (2025), and WRc’s analysis of the same data (2026), for the water figures and the concentration caveat; Bluefield Research for the indirect-water estimate; Amazon’s 2025 water disclosure (June 2026); ISO/IEC 30134 (PUE, WUE, CUE, ERF, REF); the EU Data Centre Energy Efficiency Package and Germany’s Energy Efficiency Act for the rating scheme and standards. Figures are as reported by their sources and graded on the Verified, Announced, Contested, Estimated scale. Fast-moving claims are current to the 30 June 2026 cut-off. Mark Acton contributed on the record.
The read
Four myths, one mistake
Entelligencia · Adam Roberts
The four claims look unrelated, but they share a structure. Each blames the building for demand the building does not create.
The water, the power and the inefficiency are charged to the visible object, the shed by the motorway, rather than to the invisible thing that drives all of it, which is the digital life the rest of us have chosen. The demand is ours; the building is only where it lands.
This is not a pedant’s correction. These figures decide the moratoria, the planning refusals and the headlines. Fought with the wrong numbers, a real debate, about which regions can spare the water and which grids can carry the load, is lost before it starts.
In conclusion
Correct the arithmetic first
None of this is a defence of every build. Some sites are in the wrong place, on the wrong water, drawing on the wrong grid. But you cannot have that argument honestly while the headline numbers are wrong by an order of magnitude and pointed at the wrong object.
Correct the arithmetic and the real questions get sharper, not softer. That is the companion to Losing the Room: the sector is not only losing the narrative, it is losing it to figures that do not survive contact with the engineering.
The Next Hotspot · dropping
One brief down. The map is next.
The Wrong Numbers is a Sociogencia case inside The Next Hotspot, an interactive read on where the world actually builds AI infrastructure. The full edition is live, and the remaining drops are dated below.