



record
He called it a reservoir. This chapter asks what fills it. South Africa has the deepest data-centre market in Africa. What it does not yet have is dependable power, and the operators winning here are the ones who stopped waiting for Eskom to generate it.
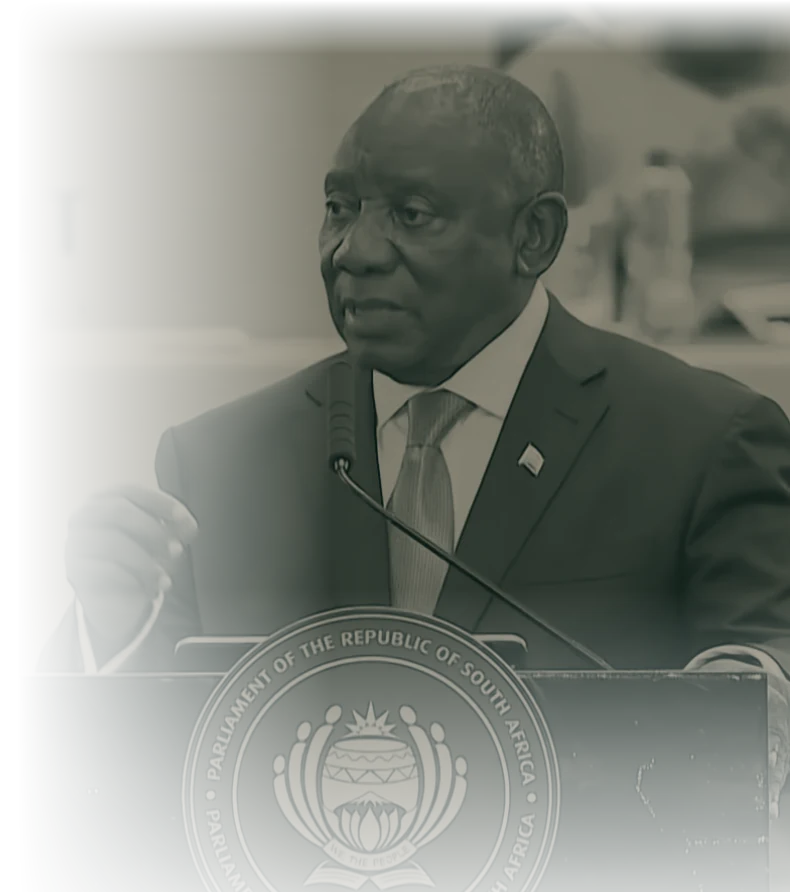
Reservoir framing: Ramaphosa, State of the Nation Address, 2026. Binding constraint, on Entelligencia's reading: power reliability.
The market is the deepest in Africa. The constraint is not capital, land, or skills. It is power you can depend on.
South Africa enters 2026 as the continent's anchor data-centre market: around 56 facilities, roughly 40% of Africa's data centres, and by power the majority of the continent's operational capacity. The market is valued at USD 2.55 billion in 2025 and is projected to roughly double to USD 5.28 billion by 2031. AWS and Microsoft Azure run cloud regions in the country; Google has announced a Johannesburg cloud region, with no firm launch date. The cable landings, the skills base, and the hyperscaler presence are real and verifiable.
The story of the last decade was load-shedding. By mid-2026 that story has eased: the country has passed four hundred consecutive days without rolling blackouts, and Eskom formally declared the energy crisis over on 25 February 2026, with the Energy Availability Factor recovering to 65.16% at FY2026 year end. But the binding constraint has not disappeared, it has moved. It is now reliability and price. Energy alone exceeds USD 1.2 million per facility per year, a load-shedding risk premium still adds about USD 20 per MWh over the Johor equivalent, and the next limit is transmission capacity, not generation. Utilisation already runs above 83% and is projected past 94% by 2030.
The thesis for the chapter is this: the operators winning in South Africa are the ones who stopped waiting for Eskom to generate their power and began generating it themselves. They did not leave the grid, and could not: wheeling moves their own electrons across the public network. What they changed is the generator, not the wires. Teraco owns a 120 MW solar plant and wheels wind from NOA to its halls. Equinix is funding 160 MW of new capacity off its own balance sheet. The government has now placed data centres on the same tier as energy and ports. The reform that decides the next decade is not generation, it is whether transmission and the new wheeling market can scale fast enough. The operators who have already secured their own generation, verified below, will define which share of the announced pipeline becomes real, and every one of them still depends on the network to deliver it.
Each spoke is one precondition, scored 0 to 10 for like-for-like reading – indicative editorial weighting, not a published index. Select any spoke or row to read the factor.
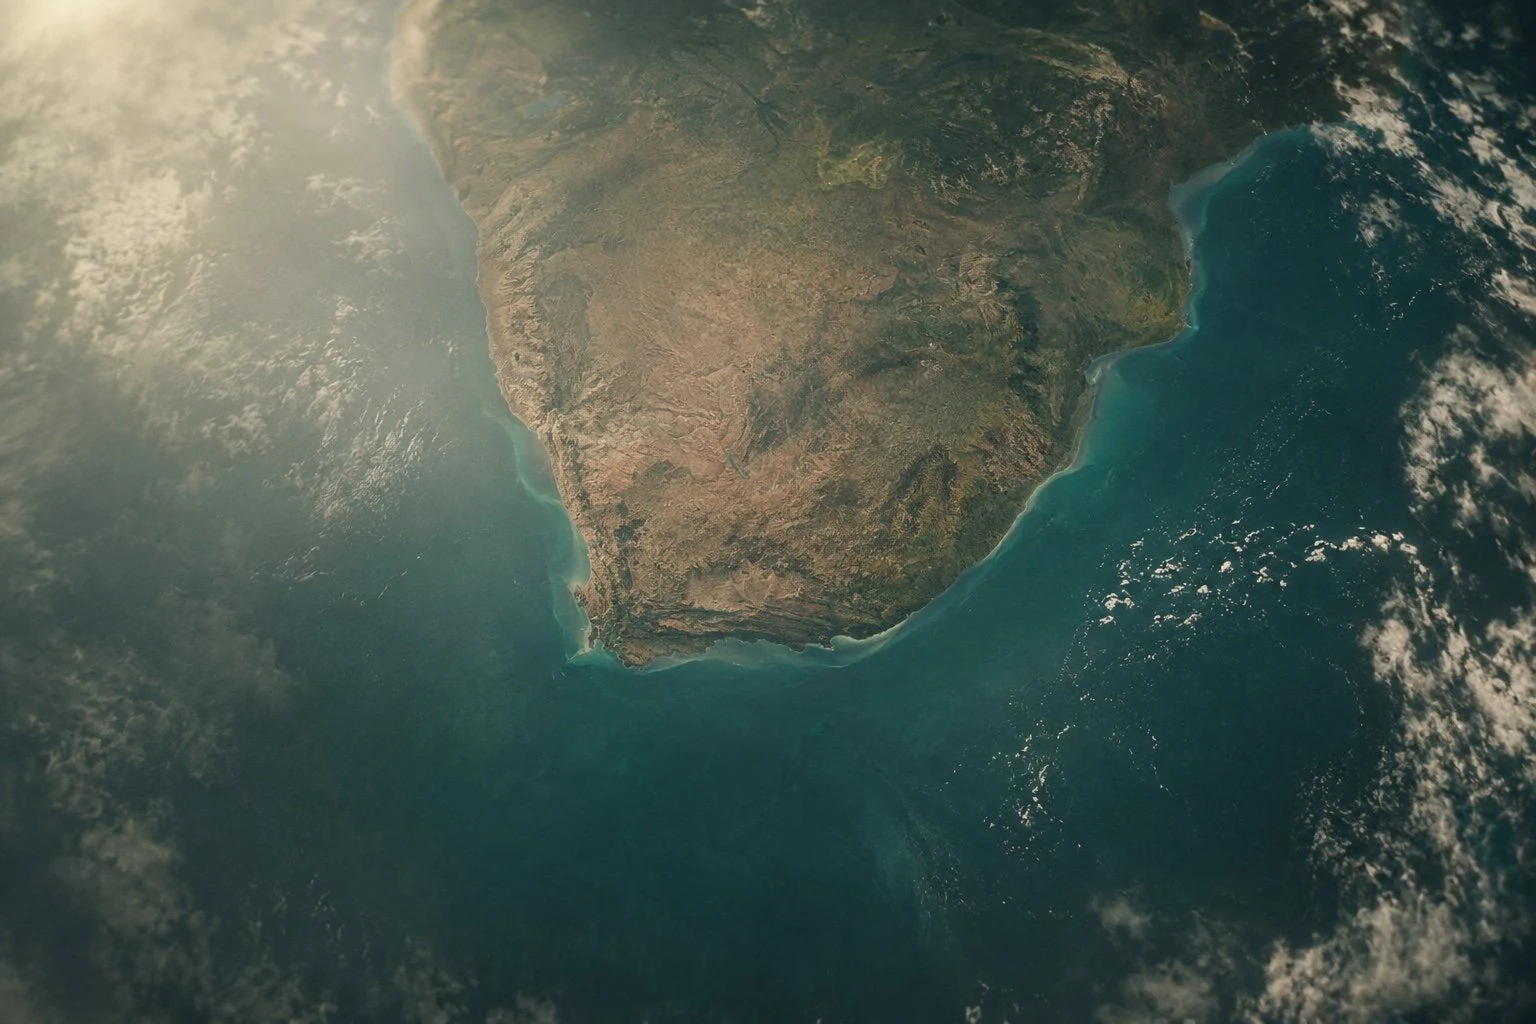
South Africa is the continental anchor. Johannesburg’s Gauteng cluster holds the bulk of live capacity, with Cape Town and Durban on the coast where the cables come ashore. Each glowing node is a real site, colour-coded by what it is – verified live or in build, announced, or a contested early-stage megaproject. Open one for the detail, filter by region, and toggle the cable landings and the grid constraint. The mountain enclave in the east is Lesotho, where a US$6.2bn hydropower-and-AI deal now sits inside South Africa’s grid. The outline follows real national boundary data and every site sits on its true coordinates.
The grid that defined South African risk has steadied. By mid-2026 the country had passed more than 400 consecutive days without load shedding, the longest stretch in a decade, after Eskom’s Generation Recovery Plan lifted the fleet’s energy-availability factor back toward the mid-60s from a 2023 low near 55 per cent. Average unplanned outages fell by roughly 3,500 MW year-on-year, the equivalent of returning a major station to service, and diesel spend on emergency turbines collapsed from R4.7 billion to under R750 million over the comparable period.
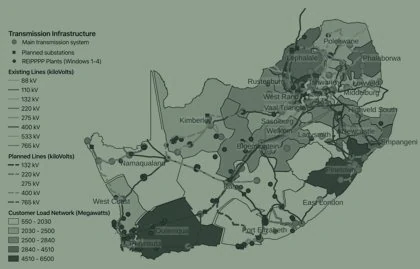
The constraint has moved from generation to transmission. The grid was built last century to push coal one way, from Mpumalanga to the metros, and it cannot evacuate the solar of the Northern Cape or the wind of the Cape coasts: more than 70 GW of advanced renewable projects sit behind saturated corridors. The newly unbundled National Transmission Company plans 14,450 kilometres of new line by 2034 at around R440 billion, but built only 108 of a 423-kilometre target in the last financial year. Until those wires arrive, wheeling clean power to a data centre stays capped by physics, not permits.
Heath Andersen takes the two things outsiders assume about African data centres and puts both down. South Africa does not have a power shortage; it has a transmission and distribution problem. And water is not the constraint people expect, because the facilities he works on are air cooled and achieving good PUEs at elevation on fresh air. What actually decides whether a project succeeds is far less exotic: whether the road and the cable on the map exist on the ground, whether customs will release your equipment, and whether you can keep the people you trained. Seven files, closing on a forecast that runs against the rest of this report. Open any file for the read. His material on the rest of the continent, on grid connection by country, ports and the operations gap, sits in Kenya, Morocco and Nigeria.
Transmission has to release grid capacity faster than demand grows. Wheeling tariffs and rules have to stay stable enough for operators to underwrite twenty-year PPAs. And the new market has to be independent enough that a self-supplying operator is not competing against its own grid host. South Africa's pipeline is not constrained by capital, land, or skills. It is constrained by dependable power and the grid that moves it. The operators who built their own supply early have bought themselves time. The rest are waiting on a reform that is announced, partial, and disputed.
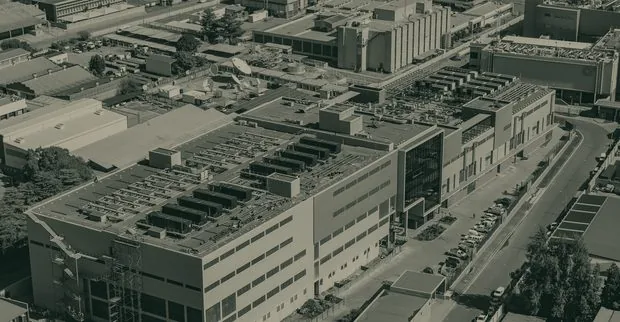
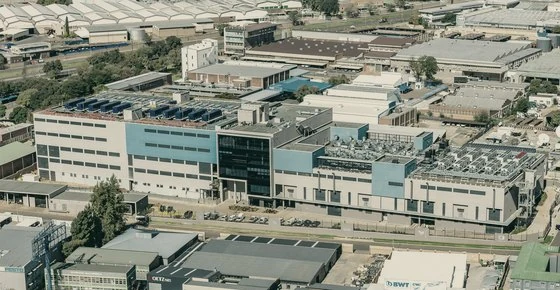
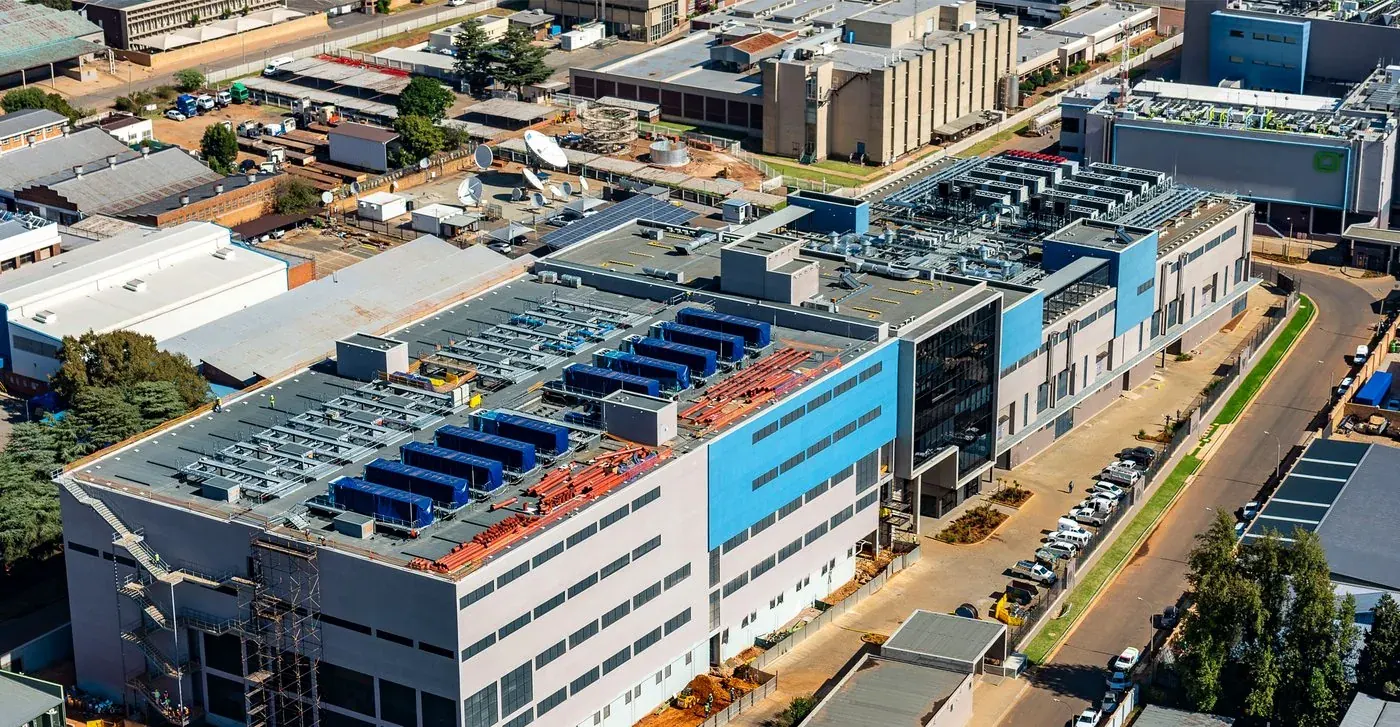
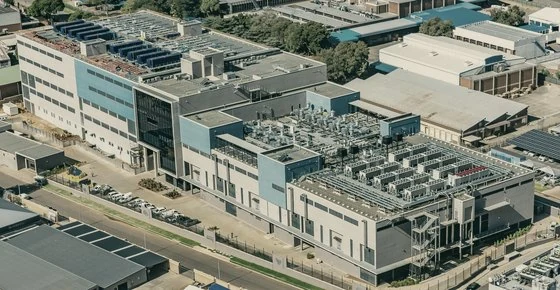
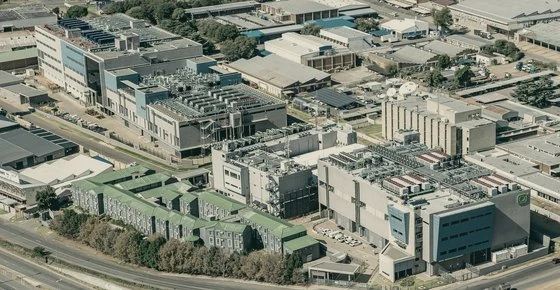
A live data-centre campus in the Isando and Kempton Park industrial node on Johannesburg's East Rand, inside the City of Ekurhuleni. Gold points are plant: how the building makes cold and takes power. Blue points are the site and its location. Every reading off the image is an Entelligencia visual inference.


Wheeling is how a Johannesburg data centre buys power from a wind or solar plant hundreds of kilometres away: the energy is fed into the grid at one point and credited at another. It takes a web of contracts, and it runs on a real, NERSA-approved Eskom tariff. Neither makes the public grid go away.
A generator's power is fed into the grid at one node and the off-taker is credited for it at another, less what it draws. The off-taker stays a grid customer throughout. Projects up to 100 MW need only NERSA registration, not a licence: the rule change that made operator self-supply practical.
WEPS active energy, nearest transmission zone, high-demand season, incl VAT. High season runs 1 June to 31 August; peak energy is roughly six times off-peak, which is what makes the time and place of generation matter.
Four transmission zones; loss factors and network charges differ by zone, so distance between plant and hall is priced in.
A stack of the primary documents behind the power question, each graded claim by claim. Click a tab to bring a document forward, click any underlined claim to see the read, or filter by grade. These are annotated representations of each source.
Four primary documents in the file. Click a tab to bring one forward.
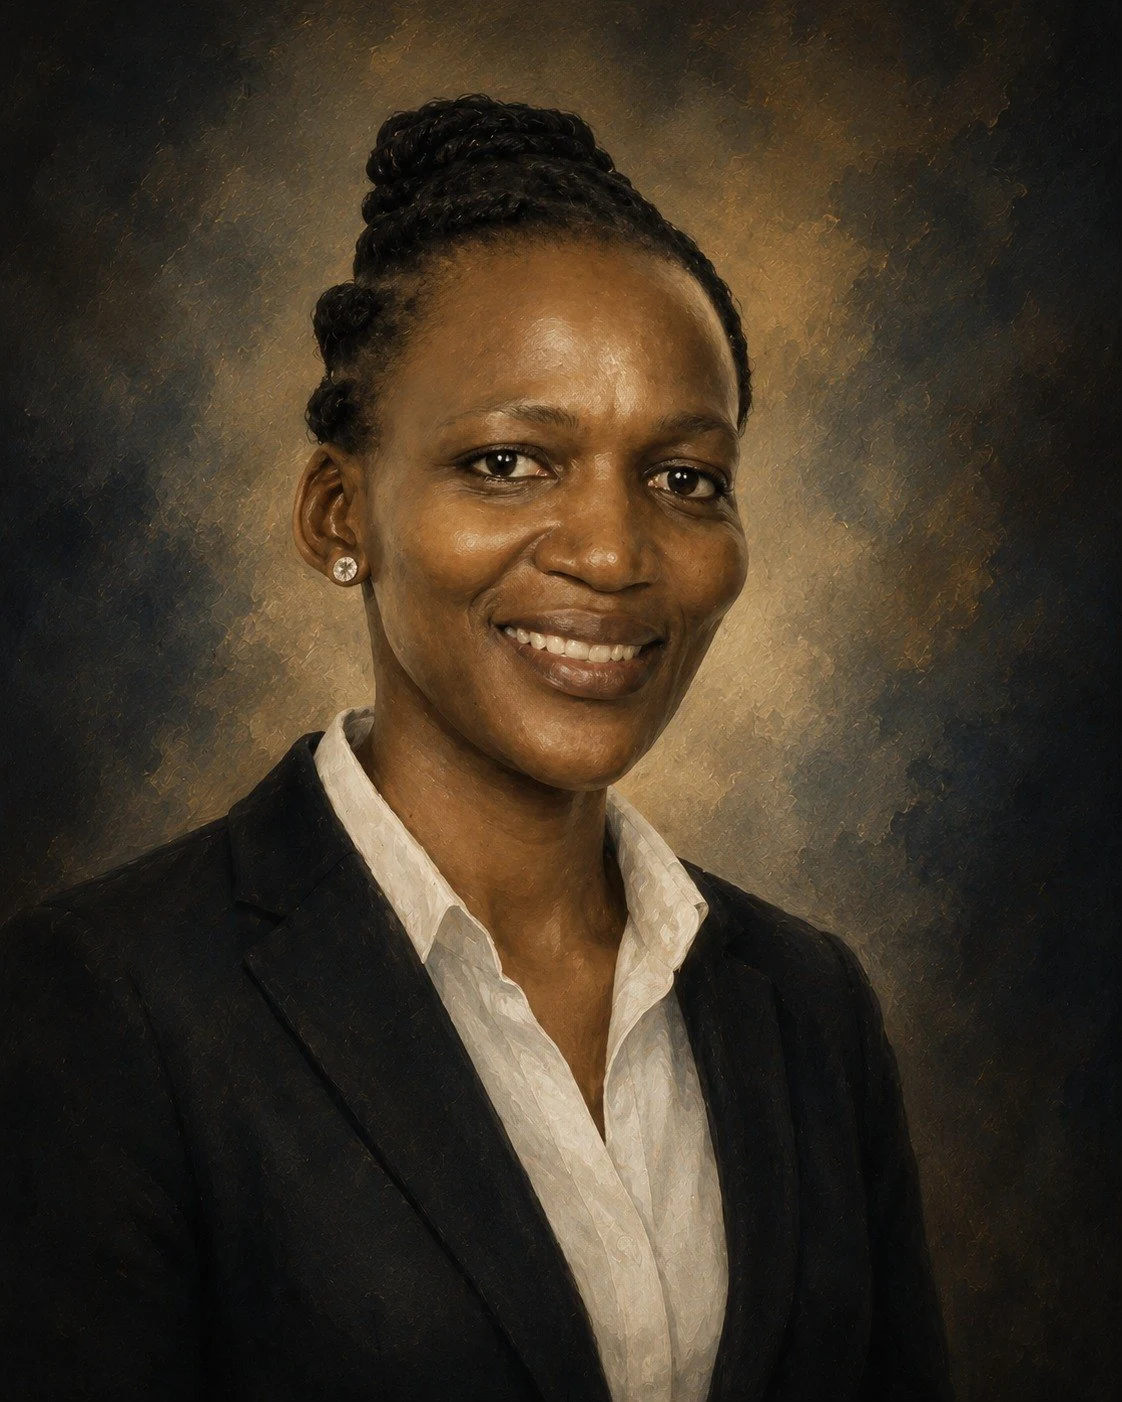
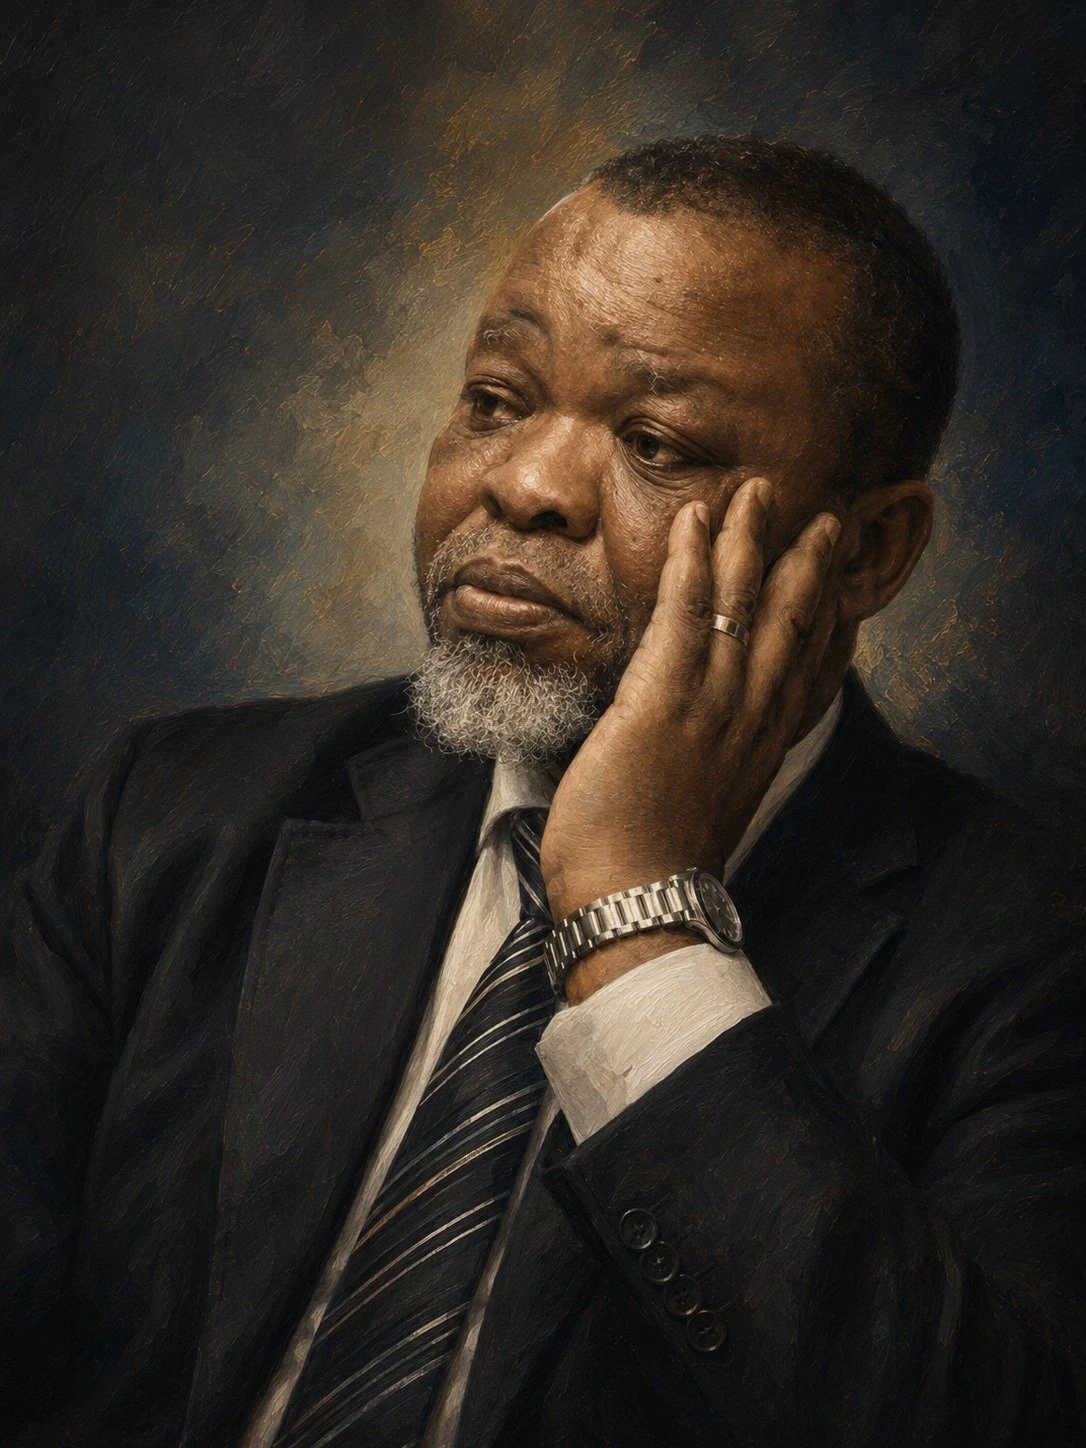
Four named figures across operator, capital, energy and hyperscaler roles, each with a real role and an on-record line. Portraits are press and supplied stills, toned for the page and licensed. Hover or tap a card.


Capital and suppliers feed the power layer and the operators, who in turn anchor the hyperscalers and enterprise demand. The South African signature is the power column: Eskom plus the wheeled renewables and municipalities that operators increasingly route around. Hover any node to trace its links, click for the brief.
05 tiers · 25 entitiesLogos are real brand assets shown for evaluation, subject to licensing or permission before any commercial use; no recreations. Solar and wind IPPs and wheeling municipalities are category groupings, shown as text nodes. The connecting lines are documented commercial and operational relationships, drawn from public filings and operator statements; they indicate direction of supply or ownership, not exclusivity, and several enterprise links are illustrative of where demand sits rather than a named contract.
Where the build actually happens, and what is in the way.