Premium-hub regulatory
The betReliability, rule-of-law and ultra-connectivity, sold at a premium rather than discounted with tax.
Indonesia is turning a consumer economy into a compute economy, with a market on a path from roughly USD 1.8 billion to USD 3.5 billion by 2031. Jakarta holds the connectivity; Batam catches what Singapore can no longer build. The question is not demand, but whether power and the grid arrive before the shortfall does.
Indonesia is two stories told at once. The first is a Singapore hedge: as the city-state runs short of land and power, the overflow lands an hour away at Batam. The second is a 284-million-person domestic market that data-sovereignty rules force onshore. Both are real. The binding question is whether the power to serve them can be built in time.
The demand side is unusually well anchored. A population approaching 284 million, a digital economy projected past USD 130 billion by the end of 2026, and Government Regulation 71/2019, which requires public-sector and public-service data to be processed inside the country. The 2019 rule in fact relaxed the older regime: private operators may now hold data offshore, so it is government and public-service systems specifically that stay onshore. Within that scope, localisation converts population into compute the way few policies do: demand that cannot be served from abroad.
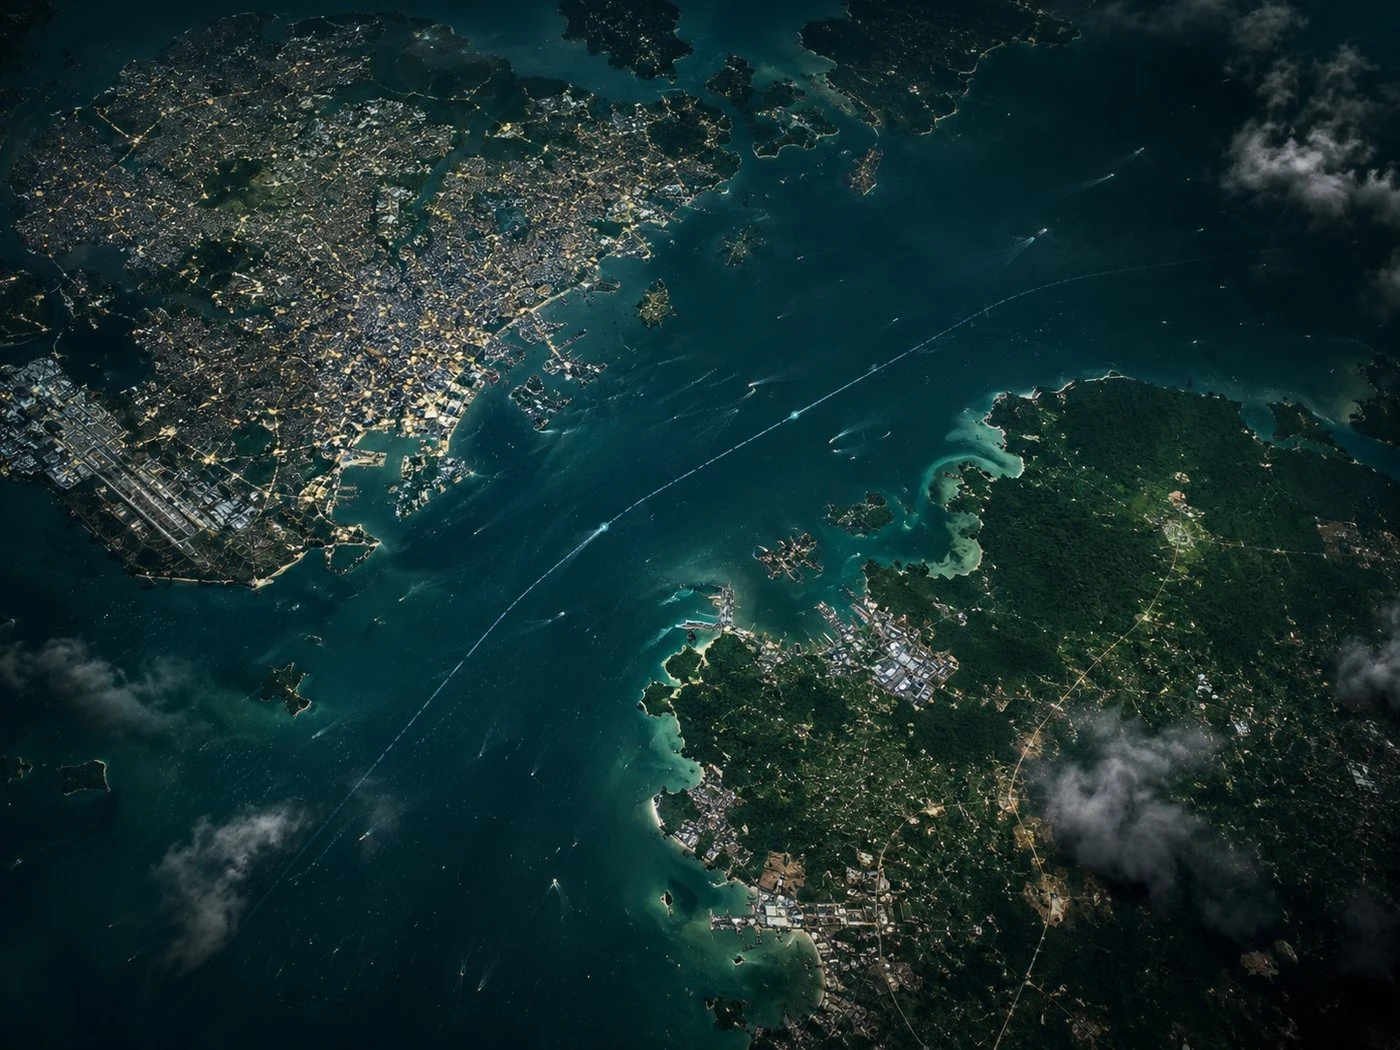
The supply side is where the contest sits, and the Batam end of it has moved fastest: in May 2026 a Chinese-backed venture committed about Rp88 trillion to a 30-hectare AI campus at Teluk Mata Ikan, Nongsa, and the island’s data-centre industry grew 22% year on year against a 19% national average. That growth has a water cost the power figures hide: the proposed nine-facility Nongsa expansion alone would draw some 29 million litres a day, and the same village protested over shortages in 2024. Live inventory was about 0.52 GW in 2025 and is projected toward 3.56 GW by 2030, yet one widely-cited report flags a possible 1 GW shortfall by that date, with Tier-4 scarcity, long grid-interconnection queues and upward pricing pressure. Jakarta holds roughly 57% of national capacity; Batam, inside a free-trade zone, is the release valve. Power and the grid, not land, decide the pace.
This chapter reads the market through five instruments: a live dashboard of the numbers that matter, a map explorer of where the megawatts land across the archipelago, a free-trade-zone comparison setting Batam against the world’s reference zones, a forensic file on the capital and the sovereignty question, and the people and supply chain who decide it. Every modelled figure is tagged; every projection is framed as such.
Across Asia, the same instrument keeps reappearing: the zone. Special economic and free-trade areas are how states bend the rules inside a border to pull digital-infrastructure capital. Set the toolkit, the strategies and the zones side by side, and Indonesia’s Batam bet reads as one hand among many.
Every zone in this edition is built from the same toolkit. The differences are in which levers a state leans on, and how hard. Open each for its definition, who uses it, and Indonesia’s version.
A drawn boundary where the normal rules are suspended: land assembled, power prioritised, and customs and licensing streamlined to pull investment that would not otherwise come.
Reduced corporate tax, investment allowances, accelerated depreciation and outright holidays, priced to move mobile capital toward one jurisdiction over another.
Rules that keep data, or public-service data, onshore, forcing or encouraging providers to build in-country in exchange for market access. The lever that makes demand un-exportable.
Renewable PPAs, renewable-energy certificates and clean-power corridors, used to make large builds bankable and meet hyperscaler ESG mandates. Increasingly a gate, not a bonus.
Special tax rates for knowledge workers, digital-skills visas and training subsidies, to staff a build that needs power, cooling, operations and cybersecurity specialists.
The same toolkit, combined differently, produces three recognisable models. Indonesia is running the second one, hard.
The betReliability, rule-of-law and ultra-connectivity, sold at a premium rather than discounted with tax.
The betZones, tax and localisation to pull the spillover the premium hubs cannot, or will not, host.
The betState capital, coverage targets and domestic champions, with controlled foreign ownership.
Who leans on what, and how hard. The same toolkit, read across the region, with Indonesia’s row highlighted.
| SEZ and FTZ | Tax incentives | Data localisation | Green energy | Talent measures | |
|---|---|---|---|---|---|
Indonesia Batam / Nongsa | Batam FTZ + Nongsa SEZ | Up to 20-yr holiday | GR 71/2019 (strong) | PLN RECs, building | Young base, thin specialists |
Malaysia Johor JS-SEZ | Johor-Singapore SEZ | 5% CIT up to 15 yr; 100% ITA | Lighter | Improving PPAs | 15% knowledge-worker tax |
Singapore Premium hub | No volume zones | Light headline incentives | Sectoral, light | Efficiency-led permitting | Deep regional talent base |
India Continental market | IT/ITES parks, GIFT City | PLI plus state subsidies | Sectoral localisation | State renewable push | Large engineering base |
China State-directed | High-tech zones | State-guided incentives | Tight data governance | State renewable scale | Domestic champions |
Vietnam Fast follower | Digital-park zones | Priority-tech incentives | Tightening | Early | Improving, lower-cost |
Each economy plotted by how heavily it leans on incentives and how far the state directs the capital and the power. Tap a point for its full zone file.
Every economy here reaches for the same prize, foreign digital-infrastructure capital, with a different hand. The horizontal axis is how far the state directs the capital and the power; the vertical is how hard it leans on incentives.
Top-right, among the directed zones: heavy incentives plus sovereign steering, right next to Johor. The contrast is Singapore, a constrained hub, and Shenzhen, a state build-out that leaned on power and patience more than headline tax.
Indonesia runs the SEZ and tax-driven catch-up model harder than almost anyone, and at Batam it stacks the strongest hands: a 70-year free-trade zone, a 20-year holiday, and the localisation rule that keeps a 284-million-person market’s demand onshore. But the instruments are only as good as the power behind them, and that is the lever Indonesia has leaned on least. Johor runs the same play with a head start and a land border; Singapore’s self-imposed limit is the whole opportunity. Grid interconnection queues can run up to thirty months, Indonesia’s equivalent of Chile’s water wall. The zone is the easy part. The power is the strategy.
A working file in five entries. Each opens into its own facts, interactive charts and comparisons, tagged Verified, Announced or Estimated throughout.
Roughly doubling by 2031 on a low-teens compound path.
The share of announced megawatts we model actually getting built.
The verified live layer at the end of 2025.
Projected live inventory, if the power and grid arrive.
Demand may outrun supply, with Tier-4 capacity scarcest.
One metro holds the majority of national capacity.
Unlocked via SEZ and ownership reforms.
For qualifying strategic data-centre investment.
Competitive against Singapore on land and power.
A digital economy past USD 130 bn by end 2026.
Each card is an entry in its own right. Click any one for the working, the interactive chart behind it and the source. Figures are tagged Verified, Announced or Estimated throughout.
The headline is the pipeline. The number that decides the decade is the gap between the capacity the market needs and the capacity that gets built. Live inventory was about 0.52 GW in 2025 and is projected toward 3.56 GW by 2030, while demand, swollen by Singapore overflow and data localisation, may run near 4.5 GW. One report flags a possible 1 GW shortfall. The communications ministry separately reports national capacity up 52% in under a year, from 190 MW in October 2024 to 290 MW by June 2025, on a narrower government tally than these gigawatt figures. Hover any point on the curves.
Of everything announced, Entelligencia models 40–55% reaching financed completion by 2030. The gap between the announced pipeline and live load is where grid-interconnection delay, Tier-4 scarcity and stranded capex live.
Open the model →Demand figures are Entelligencia readings of localisation, overflow and digital-economy growth and are Estimated. The supply line reflects w.media and databook readings of live and projected inventory. The shortfall is a published scenario, not a certainty.
Indonesia is not competing on a single hub or on being first. It is competing on scale and proximity: the largest population in the region, a young median age, data-localisation demand, and an hour’s ferry from the market that can no longer build. Singapore is the gravity it both hedges and depends on.
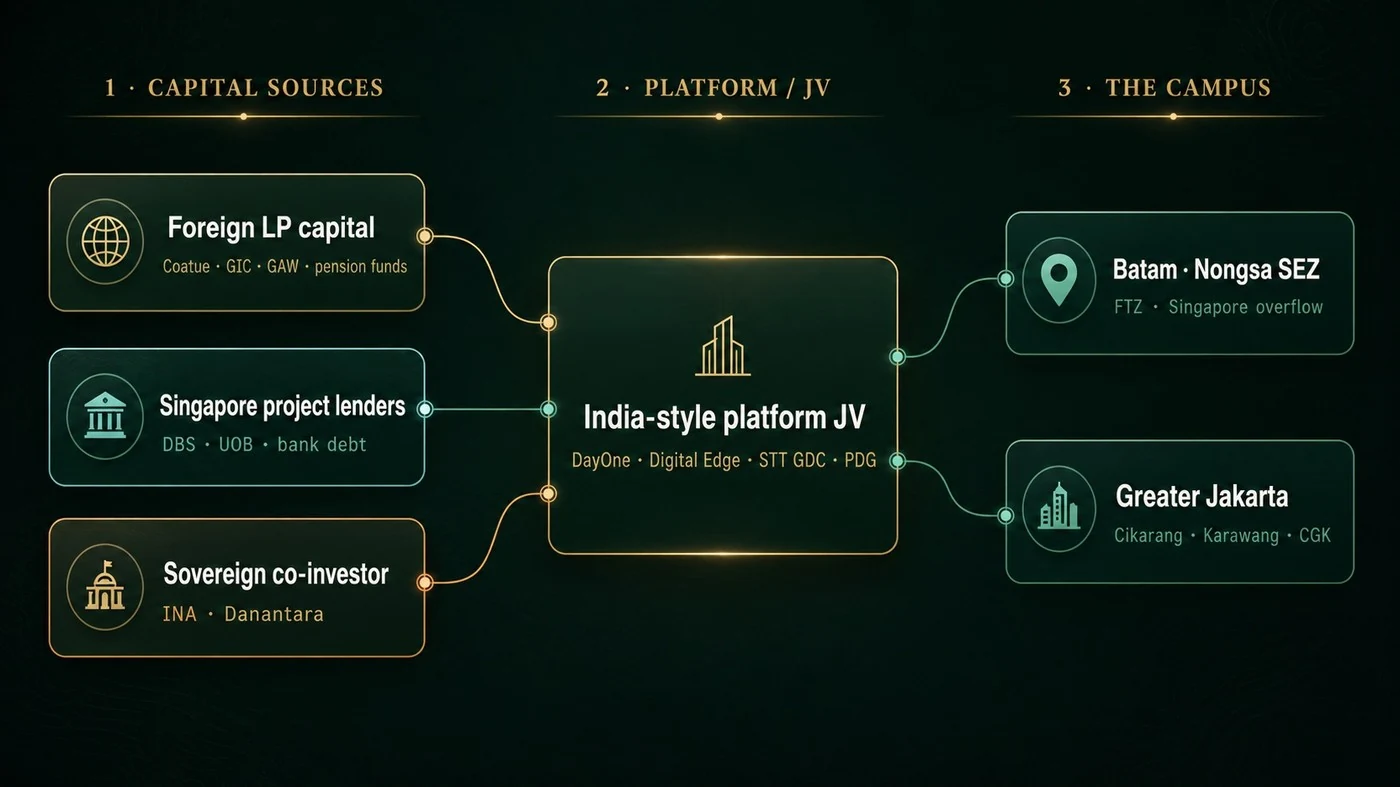
Indonesian data-centre capital arrives through a distinctive blend: global hyperscalers and operators, state-linked sovereign funds, and Singaporean project-finance lenders. The convergence is clearest at Batam, where sovereign capital, regional banks and an international operator built the same campus. It clusters into three repeatable structures.
No two houses agree on the market size, and the spread is itself the story. The disagreement is about methodology and what counts as capacity; the direction, sharply upward, is not in dispute.
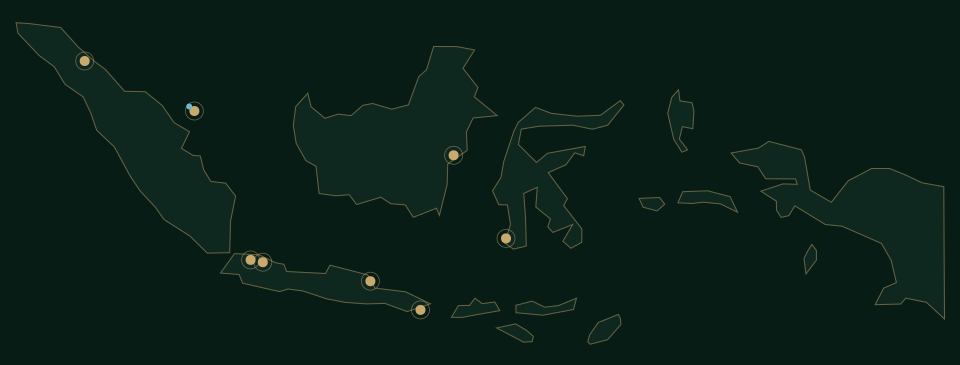
Indonesia spans thousands of islands, but the data centres do not. Java holds the overwhelming majority of national capacity, led by Jakarta; the second cluster sits across the strait from Singapore, on Batam, inside a free-trade zone. Everything else is early. Each glowing node is a real cluster, colour-coded by what it is: verified live capacity, announced, or an early-stage bet. Open one for the detail, and toggle the overlays to read the build against the Java grid, the Batam–Singapore cables and the geothermal arc. The outline follows real national boundary data and every cluster sits near its true coordinates; Singapore is marked for reference, not as Indonesian capacity.
Indonesia’s energy geography works against it. The geothermal, hydro and solar that hyperscalers need is concentrated in the eastern islands, while the load sits in the west, around Greater Jakarta and Batam. PLN’s answer is the Green Enabling Supergrid: the current electricity plan, the RUPTL, calls for nearly 48,000 kilometres of new transmission line to interconnect the islands, with a pledge that three-quarters of all new generation this decade comes from renewables.
The near-term bridge is certificates. PLN’s renewable-energy-certificate sales rose to 6.43 TWh in 2025, up almost 20 per cent, and Digital Edge’s EDGE1 became the first urban data centre to run entirely on them. But the REC market has no national exchange and no market-set price, and it remains legally undefined whether corporate purchases count toward national decarbonisation targets. That leaves the supergrid, not paper certificates, as the real test of whether the clean-energy promise reaches the racks.

The grid has to energise capacity, and firm renewable and Batam power has to arrive, faster than Singapore overflow and localisation pile on demand. The dispersal east of Java has to actually happen, so the country is not one Jakarta constraint away from a problem. And the tax and free-zone certainty has to hold long enough for sovereign and Singaporean capital to underwrite twenty-year positions. The demand is not in doubt. The power, the grid and the dispersal are the open questions.
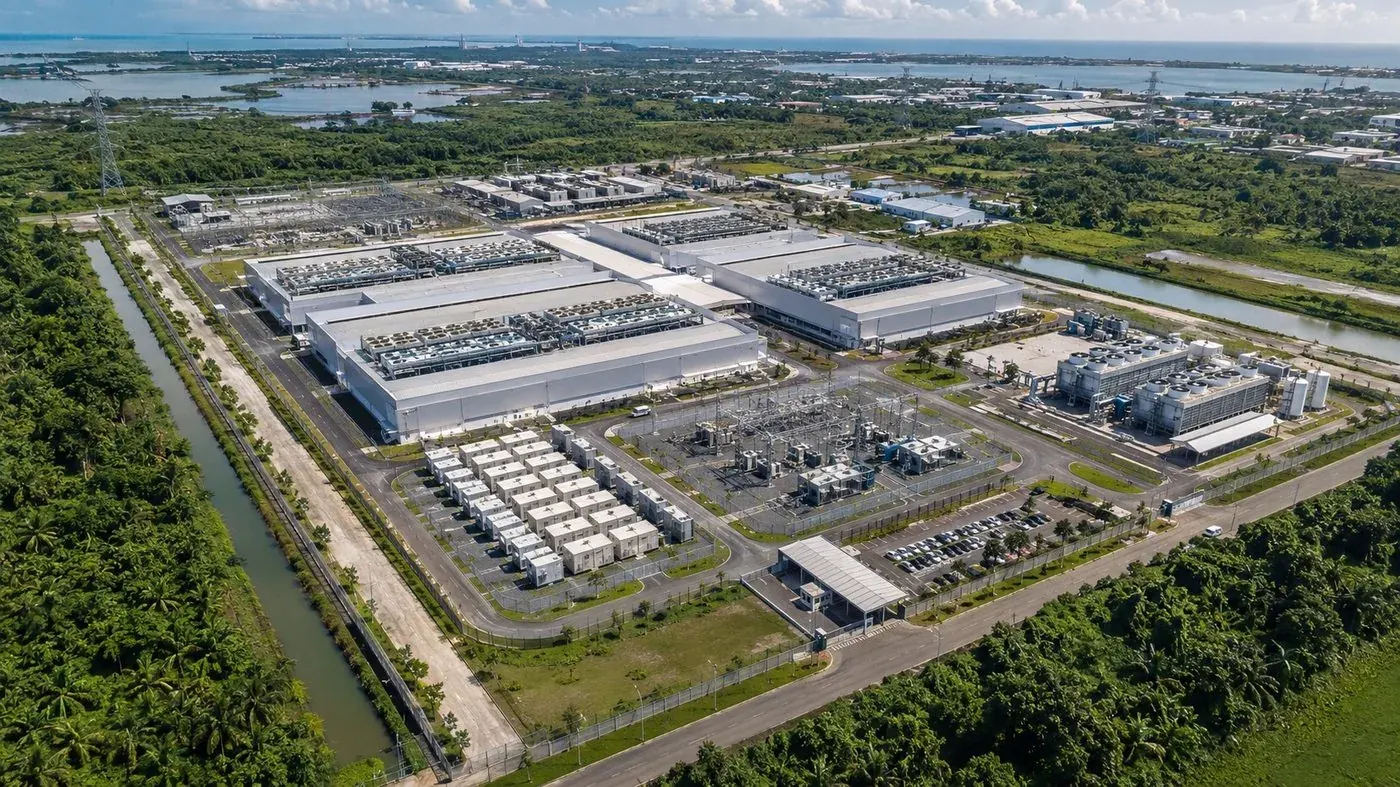
A representative aerial of a Southeast Asian hyperscale campus of the kind rising around Greater Jakarta and on Batam. Gold points are plant: how the building makes cold and takes power. Blue points are the site and its location. Element labels are Entelligencia visual inferences.
A developer’s read across Malaysia, Thailand and Indonesia, contributed to The Next Hotspot
The standard account of Southeast Asian capacity is that Singapore closed and the demand went next door. Jeffrey Tay builds across the region and puts that at roughly a third. His correction is geographic: the spillover reading holds for Johor and Batam and does not hold for the mainland, where he sees AI demand generated locally. He is also the least flattering voice in this chapter about Indonesia, and the most useful, because he supplies the mechanism behind the gap between announced and delivered capacity. Ten files, twenty-five years in Asian infrastructure, one of which contradicts this chapter directly.

Galaxy chose Thailand, and his account has Thailand legible and Indonesia opaque. He is reading a market he competes in, which is worth knowing.
It is also what makes the contribution valuable: it is the only one in this chapter that disagrees with it. This chapter argues Indonesia’s binding constraint is whether power arrives before the shortfall does. Tay’s reading is that Indonesia already lost the cycle on policy rather than power. Both cannot be the whole story, so his is published, graded, next to ours.
His 6 GW secured against a few hundred megawatts drawn is the sharpest number in the submission and the one worth chasing to a primary source. It is the same finding Landfall reaches from vendor revenue rather than grid allocation, which is the kind of agreement worth more than either route alone.
Contributed via the Entelligencia briefing survey, 28 July 2026, expanded by the contributor on 30 July 2026 and published with his approval. Thirteen questions were put; all thirteen were answered. Quotations are his own words. Where his answers have been compressed into summary above, the summary is ours and is marked as such rather than set inside quotation marks. Policy dates, capacity releases and rack-density figures are graded Verified against the public record; investment totals and utility spending plans are graded Announced as stated by the parties; his allocation-versus-draw observation and his market judgements are graded Contributed. Firm recorded on first submission as “Galaxy Date Center” and corrected to Galaxy Data Center with his agreement.
Each spoke is one precondition, scored 0 to 10 for like-for-like reading – indicative editorial weighting, not a published index. Select any spoke or row to read the factor.

Six named figures across international capital, cross-border operators, special-economic-zone leadership and policy. Each card carries a public-record position, never an invented quote; named roles and figures are re-verified against current company and government records at each staged release. Portraits are drawn from public sources and licensed.


Capital and suppliers feed the power layer and the operators, who anchor the hyperscalers and the domestic demand floor. The Indonesian signature is that the operators split two ways: the Greater Jakarta builds that serve the home market, and the Batam cluster that catches Singapore’s overflow, with PLN’s grid the gate on both.
05 tiers · 27 entitiesLogos identify the parties for evaluation only and are not an endorsement; some are real brand marks and others representative, all subject to each owner’s brand-usage rights before any commercial use. Power and renewable suppliers shown are indicative of the categories active in the market. Connections are Entelligencia’s reading of public deal and partnership announcements, graded Estimated.
Where the build actually happens, and what is in the way.